


If you are wondering what to do with your TELUS shares, you are definitely not alone. Many investors are watching the stock closely while weighing a mix of near-term jitters and long-term growth signals. Over the last week, TELUS shares dipped by about 1.9%, and looking back over the past month, the stock is down 4.1%. But step back and the picture is more mixed. TELUS is up 7.4% so far this year and has delivered a 22.7% return over five years, even though the three-year track record is negative.
Recent news around network infrastructure investments and partnerships continues to keep TELUS in the headlines, reminding investors of the company’s long-term focus on expanding connectivity and digital services. These moves sometimes add a sense of stability or optimism, but they also come with questions about risk and the pace of future growth, which can move the stock price both up and down.
With TELUS currently trading at $21.08, some investors are asking if the market is treating the stock fairly based on what the company holds and earns. A quick look at a basic valuation score, where 1 point is added for each of six key fairness checks the company passes, puts TELUS at a score of 2, suggesting it might only be undervalued by a couple of the major criteria analysts watch.
When it comes to deciding if TELUS is the right buy, sell, or hold, valuation matters. Let’s dig into the main approaches valuation experts use, and then, I’ll share a powerful way to look at value that just might change your mind.
TELUS scores just 2/6 on our valuation checks. See what other red flags we found in the full valuation breakdown.
Approach 1: TELUS Discounted Cash Flow (DCF) Analysis
The Discounted Cash Flow (DCF) approach estimates what a company is really worth by projecting its future cash flows and then discounting those amounts back to today’s dollars. This helps investors judge if the current market price fairly reflects TELUS’s long-term earnings power.
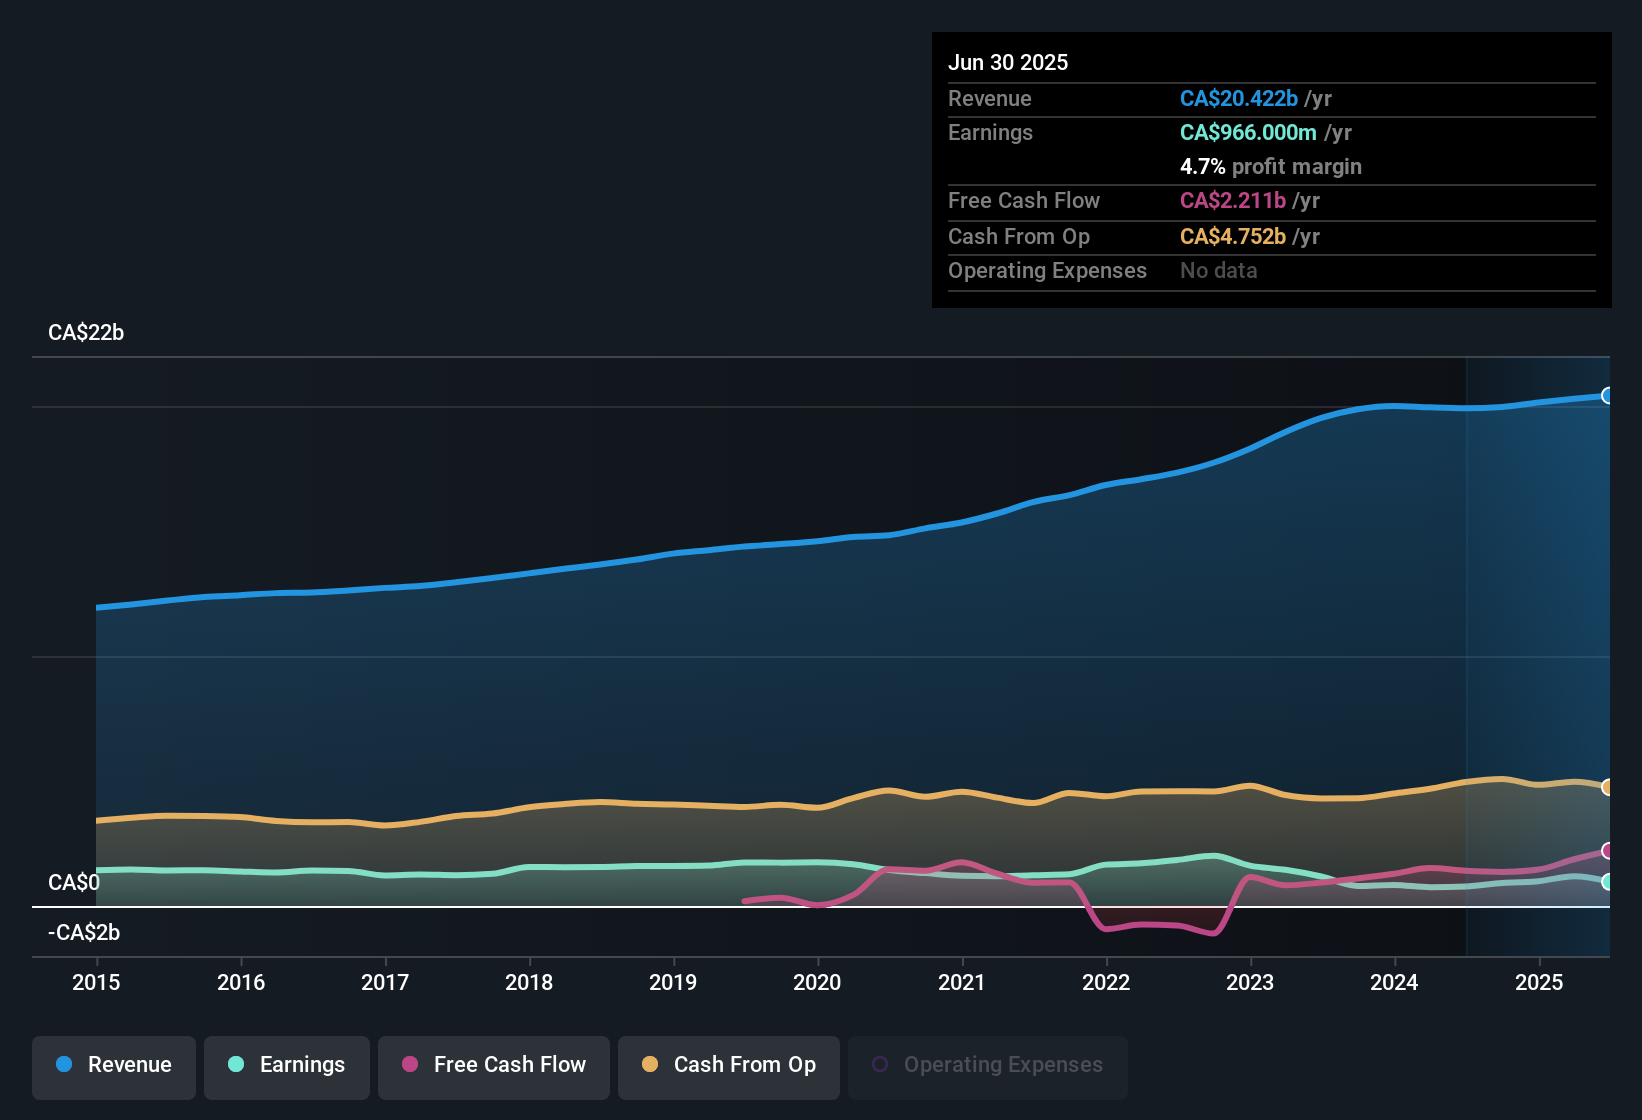
For TELUS, the current Free Cash Flow (FCF) over the last twelve months sits at CA$1.52 billion. According to analyst estimates, this figure is expected to rise over the coming years, reaching CA$2.48 billion in 2026 and CA$3.25 billion by 2029. Projections beyond 2029 are based on industry-standard assumptions. It is important to note analyst visibility typically extends only five years, so further numbers are estimates. All figures are in Canadian dollars.
Bringing it all together, the DCF model calculates an intrinsic fair value of CA$45.82 per share. With TELUS trading at CA$21.08, this points to the stock trading at a 54.0 percent discount to its estimated value, suggesting the market may be underappreciating the business’s long-term cash-generating ability.
Result: UNDERVALUED
Head to the Valuation section of our Company Report for more details on how we arrive at this Fair Value for TELUS.


Our Discounted Cash Flow (DCF) analysis suggests TELUS is undervalued by 54.0%. Track this in your watchlist or portfolio, or discover more undervalued stocks.
Approach 2: TELUS Price vs Earnings
The Price-to-Earnings (PE) ratio is a widely used valuation metric for profitable companies because it shows how much investors are willing to pay for each dollar of earnings. This makes it especially useful for established businesses like TELUS, where consistent profits make earnings-based multiples a logical choice for comparison.
What counts as a “fair” PE ratio depends on more than just the number alone. Higher growth prospects or stronger competitive positions often justify higher multiples, while increased risk or sluggish earnings growth can pull them lower. That is why it is important to compare TELUS’s current PE ratio with industry standards and competitors before making any decisions.
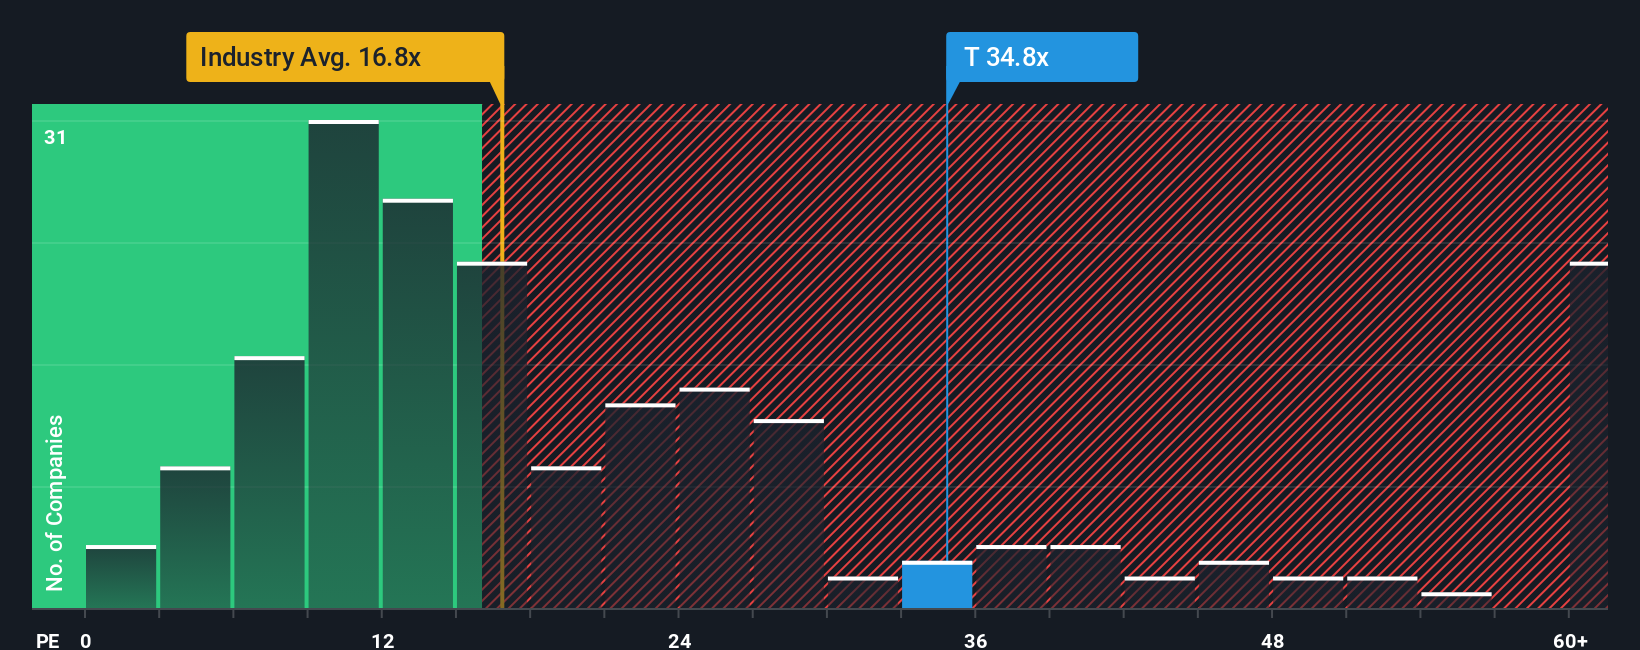
Currently, TELUS trades at a PE ratio of 33.5x. This is considerably higher than the average for the Canadian telecom industry at 16.7x and its peer group average of 25x. To get a more tailored perspective, Simply Wall St introduces the “Fair Ratio,” which in this case is calculated as 18.0x. Unlike basic peer or industry comparisons, the Fair Ratio factors in TELUS’s earnings growth outlook, profit margin, market cap, and sector-specific risk for a more accurate view of what the multiple should be.
Comparing the Fair Ratio of 18.0x to the company’s actual PE of 33.5x suggests the market is pricing in greater growth or stability than TELUS’s fundamentals might justify.
Result: OVERVALUED
PE ratios tell one story, but what if the real opportunity lies elsewhere? Discover companies where insiders are betting big on explosive growth.
Upgrade Your Decision Making: Choose your TELUS Narrative
Earlier we mentioned there is an even better way to understand valuation, so let’s introduce you to Narratives. A Narrative is a simple, powerful way to connect the story you believe about a company directly to your financial forecasts and the fair value you calculate. Rather than just relying on numbers, you add your reasoning, assumptions, and expectations into a personalized forecast.
Narratives make investing accessible because they let you clearly express why you think a company’s future will unfold a certain way, link your story to revenue, earnings, and margin forecasts, and then instantly see the fair value your view would generate. On Simply Wall St’s Community page, millions of investors use Narratives to compare and discuss these perspectives, helping everyone understand which stories might support a buy, sell, or hold, especially when Fair Value is compared to the current Price.
What makes Narratives uniquely dynamic is that they are updated live as new news, data, or earnings reports arrive, so your assumptions can evolve in real time. For example, one TELUS Narrative could reflect a very optimistic forecast for broadband and digital health growth, resulting in a CA$30 price target. A more cautious Narrative, focused on competitive or regulatory risks, might leave fair value closer to CA$20.
Do you think there’s more to the story for TELUS? Create your own Narrative to let the Community know!
This article by Simply Wall St is general in nature. We provide commentary based on historical data
and analyst forecasts only using an unbiased methodology and our articles are not intended to be financial advice. It does not constitute a recommendation to buy or sell any stock, and does not take account of your objectives, or your
financial situation. We aim to bring you long-term focused analysis driven by fundamental data.
Note that our analysis may not factor in the latest price-sensitive company announcements or qualitative material.
Simply Wall St has no position in any stocks mentioned.
Valuation is complex, but we’re here to simplify it.
Discover if TELUS might be undervalued or overvalued with our detailed analysis, featuring fair value estimates, potential risks, dividends, insider trades, and its financial condition.
Access Free Analysis
Have feedback on this article? Concerned about the content? Get in touch with us directly. Alternatively, email editorial-team@simplywallst.com
link